3.5 Customization
The Customization menu is at the top of the Google Analytics page above the reporting options, and includes dashboards and custom reports. There should be a few examples of each for you to look at through the demo account.
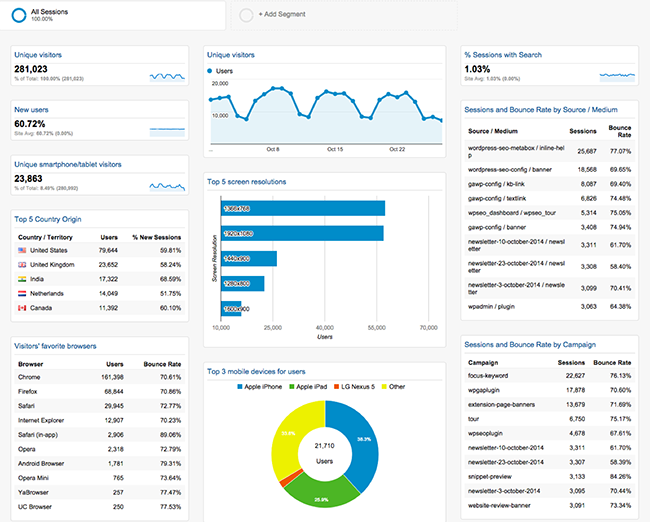
Dashboards
A dashboard is a collection of ‘widgets’ that together provide an overview of the reports and metrics you care about most, all in one place.
There are a few different ways of working with dashboards in Google Analytics. You can:
- modify the default dashboard,
- create new dashboards from scratch, or
- import someone else’s ‘shared’ dashboard.
A shared dashboard is a dashboard that someone else has set up and then made publicly available.
Also worth a mention is that other dashboard solutions are available. For example, Google Data Studio, is more user-friendly and allows you to display Google Analytics, Adwords and YouTube metrics, along with data imported from spreadsheets and databases.
There’s also generic dashboards such as Dasheroo, Cyfe, and Klipfolio, which can include metrics from many different sources. They allow you to incorporate Google Analytics metrics along with metrics from many different platforms, including Facebook, Twitter, Instagram, LinkedIn, PayPal, SurveyMonkey, and your email marketing service such as AWeber or MailChimp, for example.
Custom Reports
A Custom Report is a report that you create. You pick the dimensions (City and Browser, for example) and metrics (Sessions, Pageviews, and Bounce Rate, for example) and decide how they should be displayed. You must specify at least one dimension and one metric.
There is also the option to import a ‘shared’ custom report.
Importing Shared Dashboards or Custom Reports
When you import a shared dashboard or custom report into your Google Analytics account, it becomes populated with your account’s data. You can then modify the dashboard or custom report as required. This a good place to start, because rather than trying to reinvent the wheel, you can modify the imported resource according to your requirements.
There’s lots of sites where you can obtain shared dashboards and custom reports. Here are a few to take a very quick look at, just so you know they’re there:
- 12 Awesome Custom Google Analytics Reports
- Google Analytics Solutions Gallery
- 5 Custom Google Analytics Dashboards And How To Use Them